LabVIEW MathScript開發(fā)算法:第二部分——MathScript 交互式窗口

% Program P2_1
本文引用地址:http://2s4d.com/article/201701/337021.htm
% Simulation of an M-point Moving Average Filter
% Generate the input signal
n = 0:100;
s1 = cos(2*pi*0.05*n); % A low-frequency sinusoid
s2 = cos(2*pi*0.47*n); % A high frequency sinusoid
x = s1+s2;
% Implementation of the moving average filter
M = input(Desired length of the filter = );
num = ones(1,M);
y = filter(num,1,x)/M;
% Display the input and output signals
clf;
subplot(2,2,1);
plot(n, s1);
axis([0, 100, -2, 2]);
xlabel(Time index n); ylabel(Amplitude);
title(Signal #1);
subplot(2,2,2);
plot(n, s2);
axis([0, 100, -2, 2]);
xlabel(Time index n); ylabel(Amplitude);
title(Signal #2);
subplot(2,2,3);
plot(n, x);
axis([0, 100, -2, 2]);
xlabel(Time index n); ylabel(Amplitude);
title(Input Signal);
subplot(2,2,4);
plot(n, y);
axis([0, 100, -2, 2]);
xlabel(Time index n); ylabel(Amplitude);
title(Output Signal);
axis;
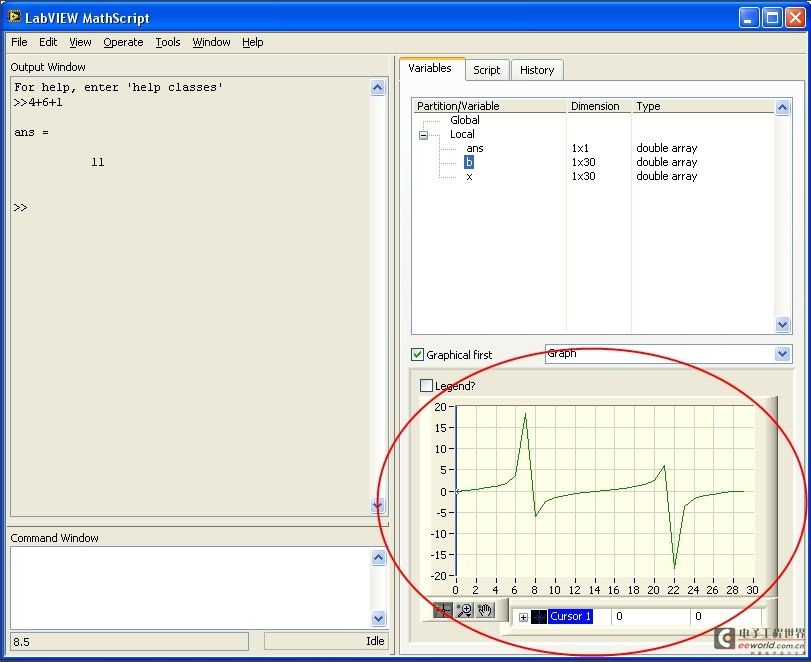
您可以使用Command Window文本框來找出更多命令信息。利用在Command Window


評論